Understanding Forecast results
Last updated: March 19, 2026
This article details the data provided on the forecast results page.
Headline data
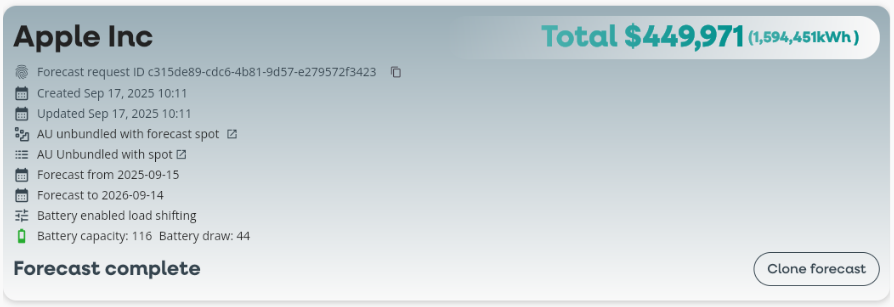
This section displays the input configuration for the forecast as well as the total value of all charges, and the total volume forecast or rated.
Forecast summary
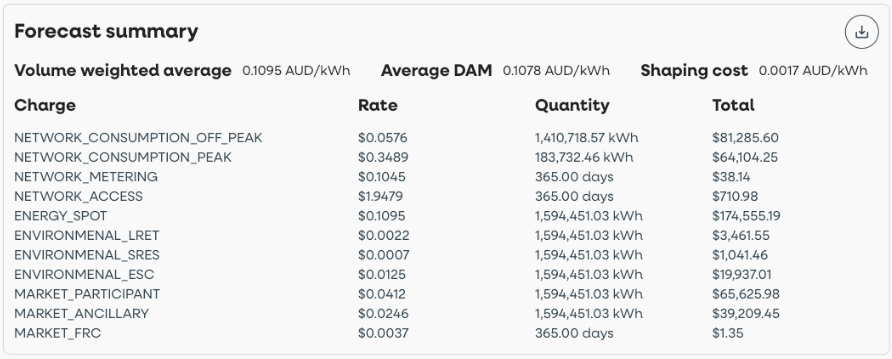
This section displays the charge totals as per the rate codes provided to the forecast (remember, rate sets specify one or more rate codes).
If the Rate Set specifies a price curve (e.g. spot prices), additional metrics are displayed:
Volume weighted average (also referred to as VWA in the Forecast Breakdown). This is equal to the total value of the spot charges / total volume.
Average DAM. This is the average spot price over the duration of the forecast.
Shaping cost. The difference between the VWA and the Average DAM.
Charge data
Charge. This is the rate code specified in your Rate Set. Where the charge identified a rate which specified partition definitions the charge is split as per the time of day rate definitions. The charge code is appended with the partition part name specified (e.g. PEAK or OFF_PEAK).
Rate. This is the average rate applied to the charge. Total value / Total Quantity.
Quantity. The total volume or quantity applied to the charge. Where applicable volume is calculated as per partition definitions.
Total. The total value calculated for the specified charge
Forecast breakdown
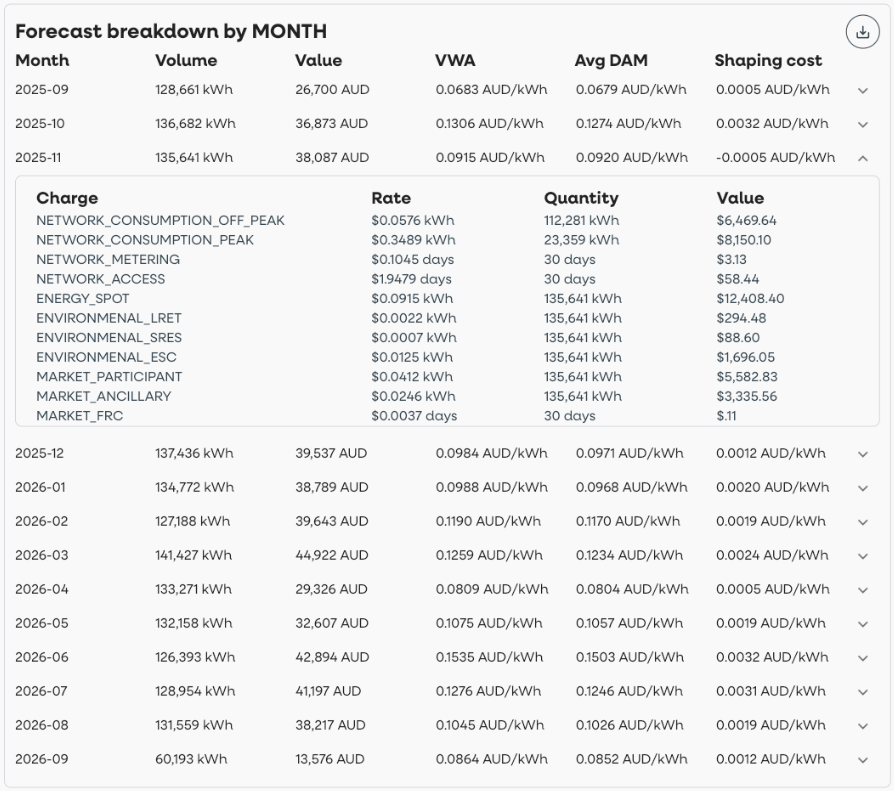
This section allows inspection of charges per month. Expand the collapsible menu to view charges for any given month. For definitions of data in this section refer to the Charge data specification above.